Healthy NY Plan- Get Instant Healthy NY Quotes & Coverage
UPDATED FOR 2020: Healthy NY is no longer available for individuals and the self-employed, however, it’s still an option for small groups. The closest cost-effective option is the Essential plan, which ranges from 0 to $46 per month. For additional information on how to qualify, give us a call at (888)215-4045
Are you looking for Healthy NY quotes and coverage? You’ve come to the right place! At Vista Health Solutions we offer everything you need to get Healthy NY coverage and quotes all in one place. Simply complete the quote form above and you can instantly compare health insurance quotes that you qualify for. Have questions about the Healthy NY application and Healthy NY requirements? Call us today at 888-215-4045 to speak with a customer service professional that can answer all of your questions about the Healthy NY program.
Healthy NY was designed to help promote comprehensive and quality health care for small business owners and their employees. The program also helps sole proprietors and those whose employers do not provide New York health insurance for them.
The Healthy NY program includes benefits that cover essential health needs including:
- Inpatient and outpatient hospital services
- Physician services
- Maternity care
- Preventative health services
- Diagnostic and x-ray services
- Emergency services.
Applicants may now also choose a benefit package with a limited prescription drug benefit or a benefits package without a prescription drug benefit.
Vista Health Solutions offers several quality health plans to those who qualify. By filling out the Healthy NY application above you can view quotes instantly! Vista Health Solutions deals mainly with the Empire and Oxford health care plan providers to bring you the most comprehensive coverage possible at the lowest available Healthy NY cost.
 |
Not sure if you qualify?
Here is a breakdown of the Healthy NY requirements:
| Individuals to be Insured |
Annual Income |
| Applicant |
below $27,084 |
| Applicant and Spouse |
below $36,432 |
| Applicant and Child |
below $36,432 |
| Applicant and 2 Children |
below $45,780 |
| Family (Applicant, Spouse, and 1 Child) |
below $45,780 |
| Applicant and 3 Children |
below $55,128 |
| Family (Applicant, Spouse, and 2 Children) |
below $55,128 |
| Family (Applicant, Spouse, and 3 Children) |
below $64,476 |
| Applicant and 4 Children |
below $64,476 |
| Family (Applicant, Spouse, and 4 Children) |
below $73,836 |
| *add $9,360 per year for each additional individual | |
The following are some of the carriers offering Healthy New York Insurance plans through Vista Health Solutions:
- Aetna
- Empire
- Empire Healthcare Healthy NY Program
- BlueCross
- Oxford
- HIP
- Excellus
- Easy Choice
- Easy Choice Health Insurance
- Easy Choice Insurance
- GHI Healthy NY Plan
- Emblemhealth Healthy NY program
- Univera Healthy NY Plan
| NY | US | |
|---|---|---|
| Adults 19-64 Overall Employer-based Insurance Private Individual Insurance Medicaid/Other Public Uninsured |
58.0% 4.8% 17.6% 19.6% |
59.0% 5.7% 12.8% 22.5% |
| Adults 19-64 with Children Employer-based Insurance Private Individual Insurance Medicaid/Other Public Uninsured |
63.6% 3.4% 18.5% 14.0% |
64.0% 4.3% 13.0% 18.3% |
| Adults 19-64 without Children Employer-based Insurance Private Individual Insurance Medicaid/Other Public Uninsured |
55.2% 5.4% 17.0% 22.4% |
56.0% 6.5% 12.8% 24.8% |
The data above shows a comparison of the distribution of coverage in New York and nationally. Every year the Census Bureau surveys American families’ health insurance status and the kind of health plan they have.
The respondents of the survey were individuals aged between 19 and 64. This is the age group that enrolls in the Healthy NY program. The survey indicates that the number of individuals enrolled through an employer-sponsored health insurance plan in New York is the same as that at the national level.
The rate of uninsured in New York is a little lower than the rate across the nation. A lot of the insured in New York are enrolled in government-sponsored health insurance programs like Medicaid, Family Health Plus, etc. But the rate of uninsured has increased both in New York and the US. The uninsured rate in New York has increased by 1.5% while at the national level the increase is at 1.2% (for those with children) and 1.6% (for those without children).
| NY | US | |
|---|---|---|
| Adults 19-64 | 19.6% | 22.5% |
| By Employment Status At least 1 full-time worker Part-time workers Non-workers |
14.0% 26.4% 21.6% |
15.0% 33.4% 30.5% |
| By household income
(percent of the federal poverty level) |
32.7% 26.8% 15.9% 14.1% |
46.0% 25.8% 13.0% 9.5% |
Overall New York has a lower number of uninsured when compared to that of the entire country. Improvement is seen among the working individuals in New York, particularly among part-time employees. It has gone up from 24.7% to 26.4%.
Among low-income individuals, New York has a much lower uninsured rate. But among higher-income residents, New York’s uninsured is higher. Burns & Associates, Inc. (B&A) attributes this to the state’s generous Medicaid policies compared to other states
Source of the table: http://www.statehealthfacts.org/comparecat.jsp?cat=3
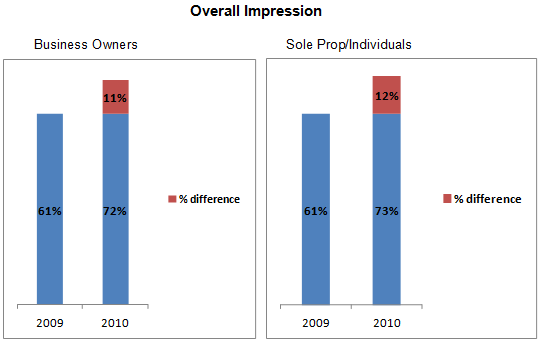
The table below reflects members’ and employers’ feedback regarding Healthy NY. Burns & Associates, Inc. (B&A) conducted two surveys, one for business owners and one for individuals. The surveys were designed in such a way that respondents covered all the various health plans, regions, the number of years enrolled in the program, and product selection.
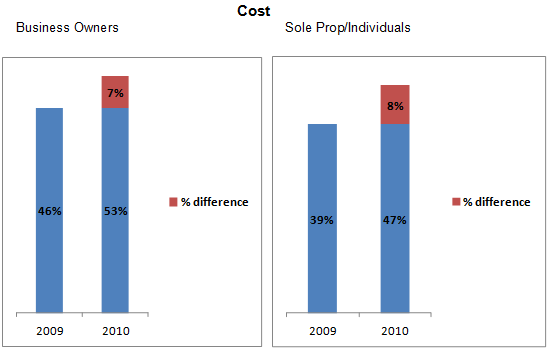
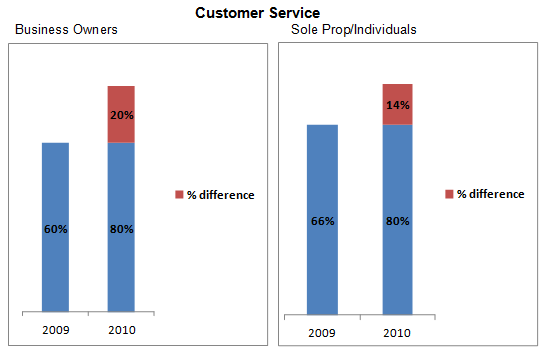
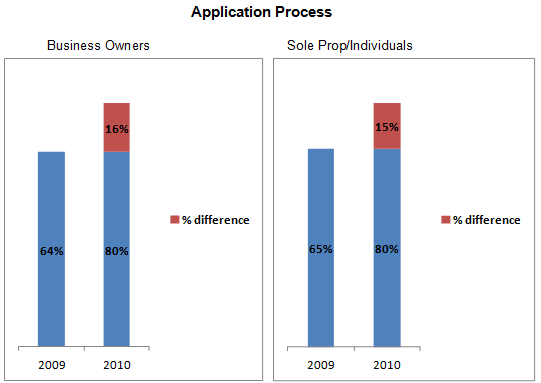
The survey for employers had 18 questions and the member survey had 16 questions. Most of the questions in both surveys were the same. Surveyees were asked to rate their satisfaction with the program in these aspects: cost, customer service, and application process. They were asked to indicate their degree of satisfaction from very satisfied to somewhat satisfied. The table below reflects the survey result and you can compare them with last the previous year’s satisfaction rate.
Percentage of Respondents who are Very Satisfied or Somewhat Satisfied
| 2010 | 2009 | Percentage
Point Difference |
|
|---|---|---|---|
| Overall Impression Business Owners Sole Prop/individuals |
72% 73% |
61% 61% |
+11% +12% |
| Cost Business Owners Sole Prop/individuals |
53% 47% |
46% 39% |
+7% +8% |
| Customer Service Business Owners Sole Prop/individuals |
80% 80% |
60% 66% |
+20% +14% |
| Application Process Business Owners Sole Prop/individuals |
80% 80% |
64% 65% |
+16% +15% |
Every year a survey is conducted to check how members feel about being part of this health insurance program. This information is included in their annual report. The survey was conducted by Burns & Associates, Inc. (B&A) during the summer of 2010.
The survey was given to 12% of sole proprietors and working individuals who enrolled as of March 2010. This totals to 8,685 members. The following variables were included:
- enrollment whether enrolled as a sole proprietor or a working individual, health plan carrier;
- county of the home address;
- year of enrollment;
- age;
- gender;
- Healthy New York plan selected
Burns & Associates, Inc. (B&A) collected information from both the Insurance Department and insurance carriers from whom more than 1% of the Healthy New York members are enrolled.
The table below shows how the respondents applied for the program. The results are very similar to the previous year.
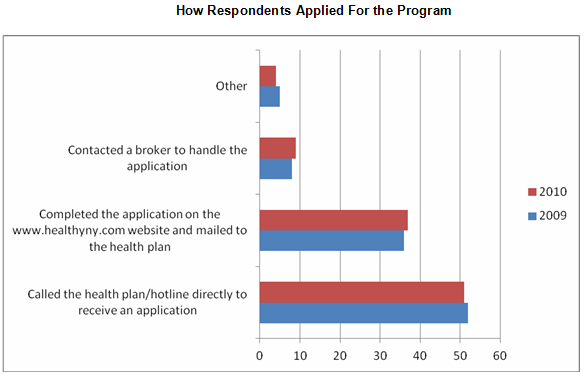
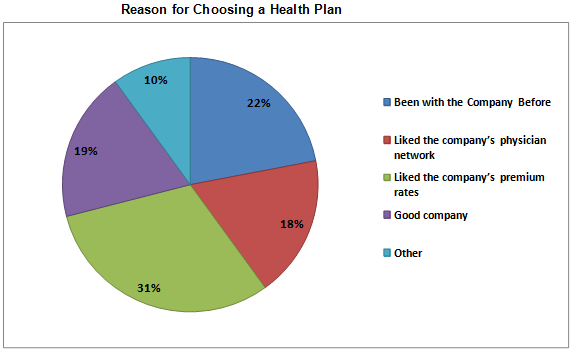
The plan’s premium rates played a major role in the respondent’s decision-making in terms of health plan choice.
Respondents were asked to rate their satisfaction with regards to their overall Healthy New York experience (taking into consideration the cots, customer service, and the application process. They were asked to rank their level of satisfaction and the result is as follows:
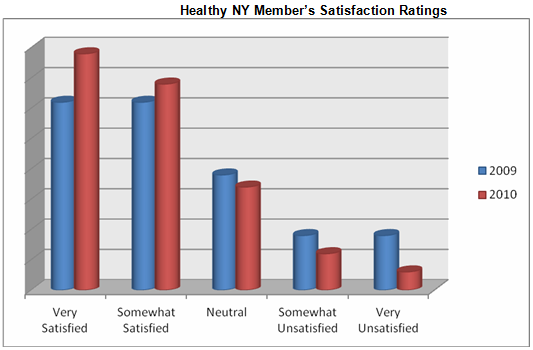
Members are more satisfied now (in 2010, when the survey was conducted) than in the previous year.
In the comments section, however, members indicated several aspects where members are not happy such as the prescription limit ($3000 per coverage year), no coverage for dental, mental, vision and chiropractic care, annual physical that’s limited to one in three years.
Enrollment in the program has increased as follows:
- 3.6% in 2008
- 3.5% in 2009
- 3.3% in 2010
Every month, there are about 3.9% and 8.6% new members. On the other hand, the discontinuation rate is between 3.5% and 7.3%. But rates for new members and discontinuing members are not that accurate. Some members discontinue their current plan and transfer to another plan from a different insurance company. This doesn’t mean however that they have already left the program:
Average Contract Size by Member Type, July 2010
Small Business Employees Sole Proprietors Individuals Total
Subscribers 35,592 13,886 68,547 118,025
Dependents 22,095 8,199 16,386 46,680
Total enrollment 57,687 22,085 84,933 164,705
Dependents as Percent of Total 38% 37% 19% 28%
Average Contract Size 1.62 1.59 1.24 1.40
The average contract size was 1.40 members. An average contract includes the policyholder and his/her dependents. Individuals have a lower contract size compared to sole proprietors or members of employer-sponsored plans.
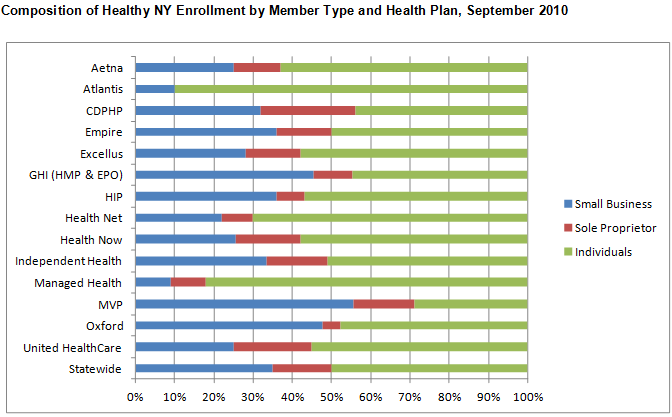
The majority (51%) of the members are individuals; 13% are sole proprietors and 36% were enrolled in group plans of small businesses. The table above gives you a picture of the membership information on health plan providers. It is noticeable that the distribution of member types vary among providers. There are some providers like MVP and GHI where the majority (50%) of their members are small business groups.
From 2006 to 2010, small business membership has grown from 27% to 35%. But the sole proprietors’ population decreased from 17% to 13%. The same is true for individuals. Membership has decreased from 56% to 52%.
In terms of product selection, HMO plans without prescription have been gaining popularity in recent years. It has become a popular choice among sole proprietors and individuals. High deductible products, on the other hand, remain to be unpopular. See table.
Product Selection
HMO with Prescription HMO without Prescription HDHP with Prescription HDHP without Prescription
Individuals 68% 22% 4% 6%
Sole Proprietors 63% 30% 3% 4%
Small Business 84% 14% 1% 1%
Small Business Groups 82% 16% 1% 1%
The table below shows you the membership distribution for every region in contrast with the regions’ population. Capital District Region, Hudson Valley, and Long Island have a higher percentage of membership compared to the region’s population percentage.
Comparison of Regional Population to Healthy New York Membership
| Region | State Population (July 2009) Percent of Population |
Healthy NY Membership (July 2010) Percent of Members |
|---|---|---|
| Capital District | 7% | 9% |
| Central NY | 6% | 6% |
| Hudson Valley | 11% | 14% |
| Long Island | 15% | 23% |
| New York City | 43% | 28% |
| North Country | 2% | 2% |
| Southern Tier | 4% | 3% |
| Western NY | 12% | 13% |
| Out of State | 1% |
How much does the Healthy NY cost? Find out by completing a healthy NY application above and you will get side-by-side rates instantly on a Healthy NY plan that works for you!
If you have any questions about your Healthy NY application or the Healthy NY requirements call one of our customer service representatives at 1-888-215-4045.
Related Articles:
Healthy New York Plan Benefits Employees and Families
Why Healthy NY Costs Less than Traditional Health Insurance Plans
The High Deductible Healthy NY Health Insurance Plan
Strong Business Sense with Healthy NY Insurance Plan